

You have the PhD. The publications. The grant money. You’ve read hundreds of papers in your field.
And yet.
Sitting down to write still feels like dragging yourself through wet concrete. You open the document. You stare at the blank page. Your brain, the same brain that designed a study and ran a lab meeting this morning, locks up. Two hours later, you’ve produced a paragraph you’ll probably delete tomorrow.
You know this feeling. The Sunday afternoon dread when you promised yourself you’d finish that discussion section sooner. The guilt when a co-author emails asking for your draft and you haven’t even started. The quiet panic at 11 PM the night before a deadline, realizing you’ve rewritten the same introduction four times and none of them feel like they work. You start wondering if you’ve lost the ability to write altogether. Maybe you never had it.
Meanwhile, some colleague who seems to have a secret portal to a parallel dimension where time moves slower just submitted three papers this semester. Same deadlines. Same teaching load. Same committee obligations.
Not going to lie, I had a moment like that in the early 2020s when Juho Hamari outpublished me as the most published researcher in the field of gamification. I felt like I was already operating at the peak of my capabilities, but I watched his research team take over the field with dozens of journal publications that outcited my work. Well done. In hindsight, I shouldn’t have compared myself to them (I was in a different situation with a very different teaching load), but it is often unavoidable when you feel like their CVs keep growing while yours sits stuck at in progress.
You assumed they had more discipline. More talent. More protected writing time (this is the academic equivalent of a unicorn sighting; you’ve heard legends, but you’ve never actually seen one in the wild).
They don’t. They have a system. That word matters.
The reality is this. You’re not bad at writing. You’re bad at how you write. Let that sink in for a moment. It’s a tough pill to swallow.
Writing productivity runs on systems. Most academics have never built one. They treat writing like a single task, one giant cognitive monolith you power through with enough discipline and so much coffee your hands are jittery. Writing is actually six different cognitive processes crammed into one activity:
- Deciding what to say (content). Choosing whether to include a specific study in your literature review, or deciding which of your three experiments to present first.
- Figuring out how to say it (language). Struggling between “participants demonstrated improved performance” vs. “performance improved” vs. “we observed performance gains.”
- Remembering who you’re saying it to (audience). Deciding whether to define “gamification” for a general social science journal or assume readers know the term in a specialized HCI venue.
- Tracking what you’ve already said (coherence). Realizing mid-paragraph that you already mentioned this limitation two pages ago, or checking if you’ve already cited Nacke et al. (2023) earlier.
- Planning what comes next (structure). Figuring out whether your next paragraph should address the second research question or first discuss the implications of your current finding.
- Judging whether any of it is good (evaluation). Stopping mid-sentence to wonder “Is this too obvious?” or “Does this sound too informal?” or “Should I delete this entire section?”
The problem is doing all six simultaneously while drafting. You’re running Chrome with 59 tabs open and wondering why your laptop sounds like a jet engine.
Most people think writing is hard because they don’t have enough willpower.
But the real problem is that writing asks your brain to do too many things at the same time.
I’ve supervised 30+ PhDs. Reviewed hundreds of papers. Written grants that got funded and grants that got rejected. The pattern is always the same. Researchers who struggle with writing aren’t lazy. They’re running their brain’s software on the wrong operating system.
Here’s the shell script that will fix it for you:
A complete system for academic writing that works with your brain’s architecture. Six protocols. Each one targets a specific cognitive bottleneck. Each one removes a decision you don’t need to make.
I just spent a full week writing this massive guide you are reading on how to write better research papers. I'm not going to lie, the irony of agonizing over a piece about writing faster was not lost on me. So, this will be a longer read. All I ask is that you try one protocol with your next paper. Then try another.
Let’s get this show on the road.
AI Research Stack members this week get: a paper-writing Notion dashboard with the complete Inverted Assembly Line workflow, all AI revision prompts, and a pre-submission checklist. Join them.
1. Start with what you know, end with what you’re promising
Here’s how most junior researchers write a paper. They open a blank document and start with the title, then the introduction, then trudge linearly toward the conclusion. This is like trying to write the movie trailer before you’ve filmed the movie.
This is cognitively backwards.
The introduction requires the highest cognitive load of any section. You’re framing the problem, positioning your contribution, making promises to the reader, all before you’ve fully articulated what you found. You’re asking your brain to do the hardest work first, with the least material to work with.
This is like Tolkien trying to write the Scouring of the Shire before he’s even gotten the hobbits out of the Green Dragon. Your brain doesn’t have the material yet.
Resequence your writing to match cognitive load:
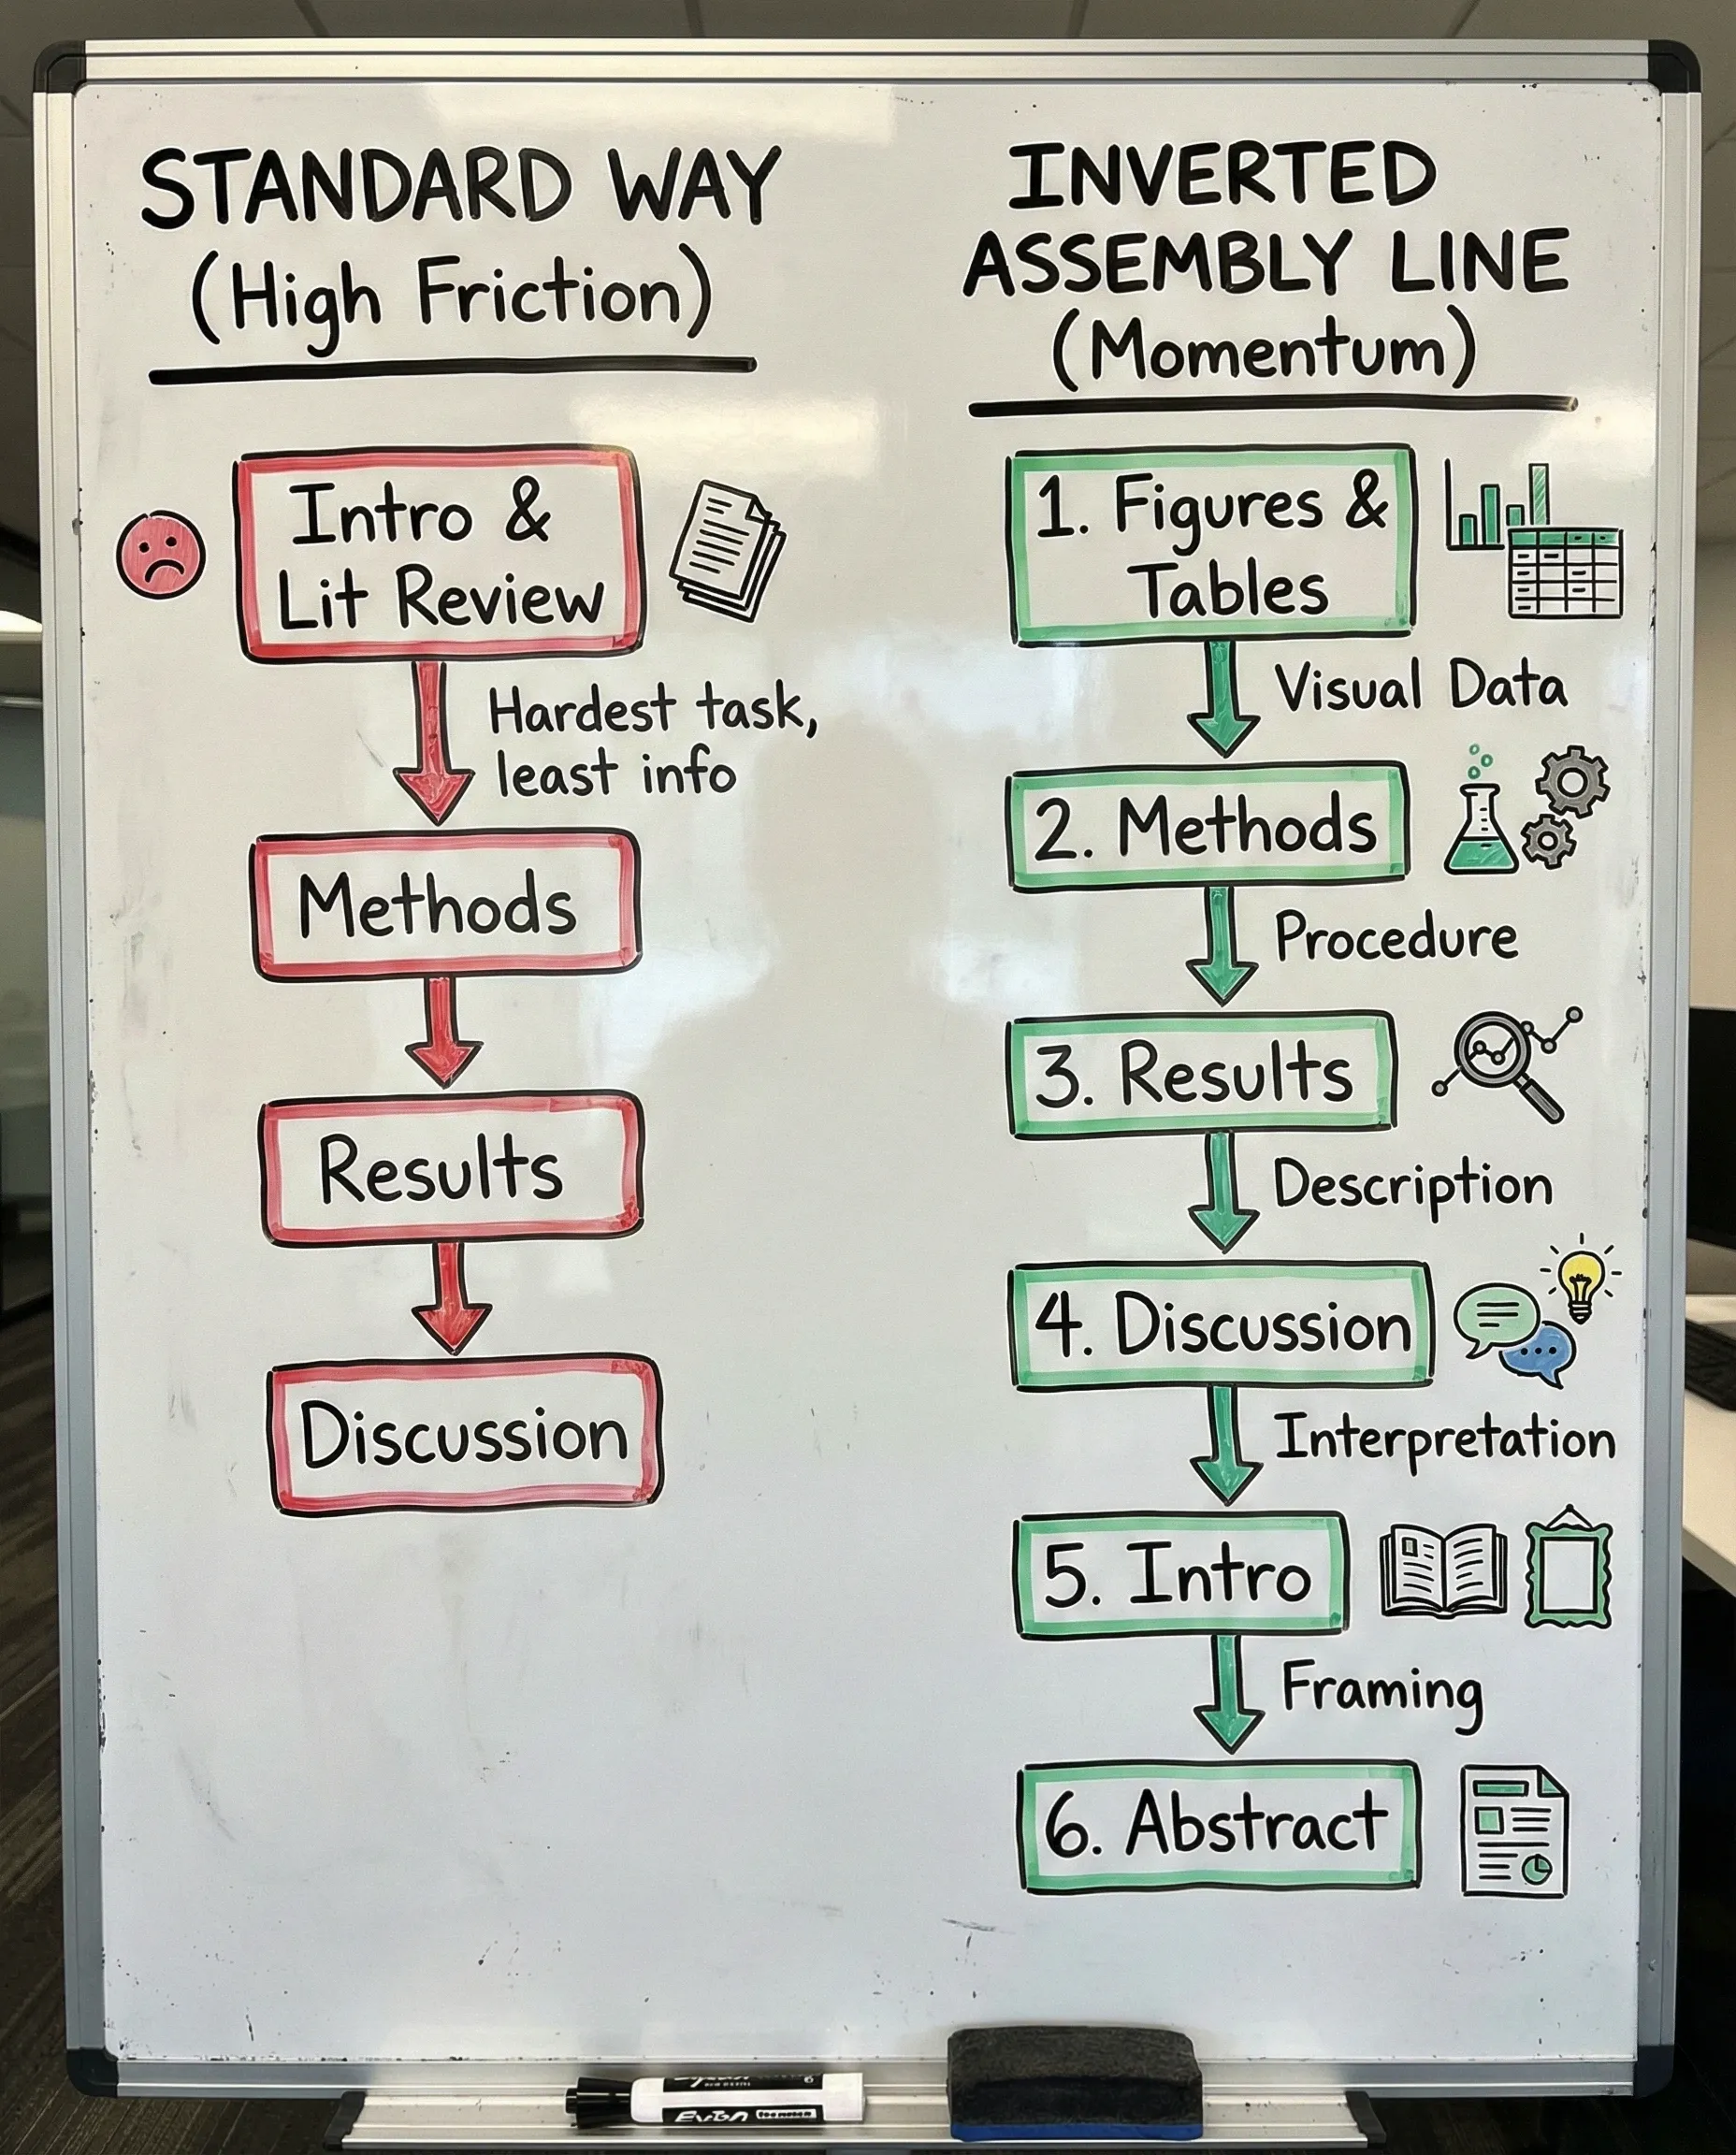
- Figures & Tables. Visual thinking. Low language load. You know your data, so just arrange it.
- Methods. Procedural recall. You did this, so describe it like a recipe.
- Results. Descriptive reporting. Narrate your figures. No interpretation yet.
- Discussion. Interpretive thinking. Connect your results to existing findings in the field.
- Introduction. Rhetorical framing. Now you know what you’re actually promising. Focus on the contribution.
- Abstract & Title. Compression and marketing. Requires knowing the whole.
Each step uses material generated by previous steps. You’re writing so that you will gain momentum. You’re riding a bike downhill instead of pushing it uphill with a flat tire.
Think of it like building a LEGO Death Star. You don’t start with the intimidating final form on the box cover. You start with bag 1, the small structural pieces you can actually see and touch.
Imagine you’re writing a paper on how gamification affects student motivation, because that’s a topic that was once super hot (bear with me, fellow non-techies).
- You start with Figures & Tables. You create a bar chart showing motivation scores across conditions. Now you can see your main effect.
- You move to Methods. You describe your 123 participants, your gamification intervention, your validated motivation scale. Easy. You did this work. You’re just documenting it here.
- You write Results. You narrate your figures: “Participants in the gamified condition reported significantly higher intrinsic motivation (M = 4.2, SD = 0.8) than in the control condition (M = 3.1, SD = 0.9), t(245) = 3.42, p < .001.” The figure tells you what to say.
- You draft the Discussion. Now you’re interpreting it all. “These results align with Self-Determination Theory, suggesting that well-designed gamification satisfies competence needs.” Your results section hands you the claims to explain, you just have to find the citations next.
- Finally, you write the Introduction. Now you know exactly what promise you’re making: “This study demonstrates that gamification can increase intrinsic motivation when designed around competence feedback.” You’re not guessing what the paper will argue. You already know.
- The Abstract writes itself. You compress what you’ve already written into 150 words. At CHI, it’s a simple formula that I’ll explain below.
Notice what happened here. Each section gave you the raw material for the next. You never faced a blank page asking, “What should I say?” The previous section already answered that question. And to make it easier for premium subscribers to The AI Research Stack, I have included a Worksheet in this week's Notion drop.
Start with what you know (methods, data). End with what requires synthesis (framing, positioning). Never write the introduction first. Save that delicious bit when you have your data all mapped out into a story.
2. Write badly first → edit later
Your brain has two modes that are neurologically incompatible. Generative mode and evaluative mode.
This distinction comes from Flower and Hayes’ Cognitive Process Theory of Writing, the most cited model of how writers actually think. Their research, based on think-aloud protocols with experienced writers, revealed that writing involves three recursive processes: planning (generating ideas), translating (turning ideas into text), and reviewing (evaluating and revising). The critical insight was that these processes compete for the same cognitive resources.
- Generative mode (what Flower and Hayes call “translating” combined with idea generation) is expansive, associative, fast. Your brain retrieves information from long-term memory, makes loose connections, follows tangents. Working memory stays open. You’re exploring possibility space without filtering.
- Evaluative mode (what they call “reviewing”) is contractive, critical, slow. Your brain compares output against internal standards, checks for coherence, judges quality. Working memory narrows. You’re applying constraints and making decisions.
The problem is that both modes require working memory, and working memory is severely limited. Trying to generate and evaluate simultaneously creates what cognitive scientists call task-switching costs. Each switch burns mental energy and breaks flow.
Years ago, I worked on a paper where I spent three hours on an introduction paragraph, and I think I wrote about nine different versions of it. I deleted most of them, patched some parts of them back together, and then the final version was eerily close to the first version. But I felt like I had burned an entire morning judging each sentence before I gave them a bit of room to breathe.
Most people try to write in both modes simultaneously. They generate a sentence, then immediately evaluate it, then edit it, then generate the next one. This is like trying to drive with one foot on the gas and one on the brake.
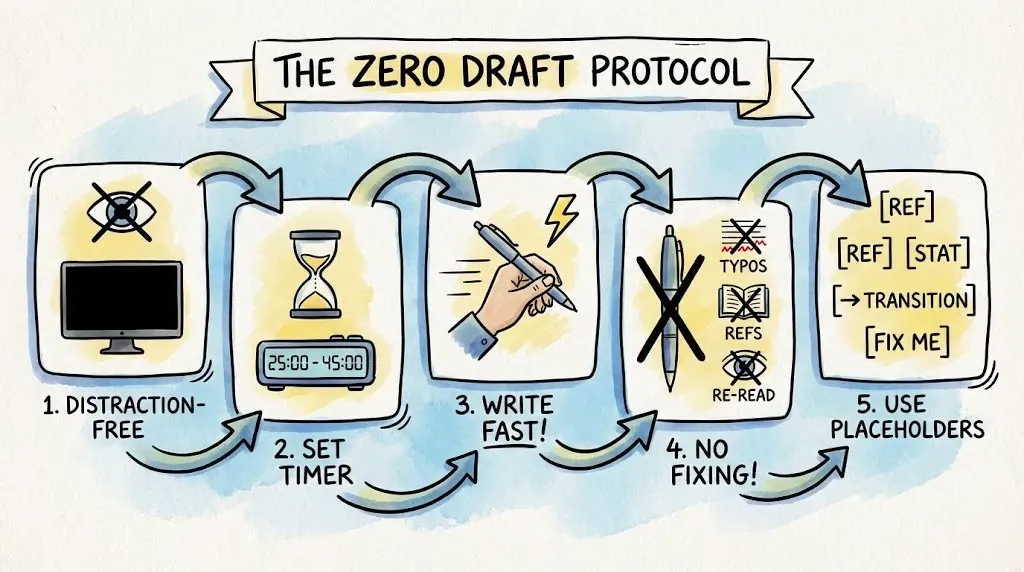
Create a Zero Draft using this strict protocol:
- Open a distraction-free writing tool (I like iA Writer and Bear, or turn off your monitor).
- Set a timer for 25–45 minutes.
- Write as fast as you possibly can without stopping.
- Do not fix typos. Do not check references. Do not re-read.
- Use placeholders liberally: [REF], [STATS], [TRANSITION], [FIX THIS].
You’re shovelling sand into a box so you can build castles later. You cannot shape sand while quarrying it. Your inner critic will scream. Let it scream. It gets its turn later. (Think of it like putting Reviewer 2 in timeout while you build the sandcastle.)
The Zero Draft gives you raw material. Raw material is infinitely easier to edit than a blank page. Even the Chicago Bulls needed to show up to practice before Phil Jackson could turn them into champions.
3. Let templates make the structural decisions for you
Every decision you make while writing burns mental fuel. What should this paragraph do? How should I structure this section? What comes next?
Most decisions about structure can be offloaded to proven templates that do the cognitive work for you. The core problem is decision fatigue. Every structural choice consumes limited cognitive resources. When you’re constantly making these micro-decisions while writing, you’re burning mental energy that could be spent on the actual intellectual work. Templates solve this by turning structural choices into a fill-in-the-blanks process, so you can analyze data, develop your argument, and articulate your insights. Instead of reinventing how to organize an abstract or discussion section each time, you follow a proven pattern to free up working memory for the substantive thinking that actually matters.
These frameworks turn the art of writing into an assembly-line process. You focus on the data. The structure does the thinking for you.
Seven templates follow. One for each major component of a paper. (Stick with me. This is where the real time savings happen.)
3.1 The CHI abstract formula (Context → Problem → Solution → Findings → Contribution)
At CHI, abstracts follow a simple formula. Five slots. Fill them in order.
- Context (1–2 sentences). Establish the lay of the land. Orient the reader in the general research area.
- Problem (1 sentence). Establish the niche. State what is missing, unknown, or broken in the current state of the art.
- Solution (1–2 sentences). Occupy the niche. Explain your method and how you addressed the problem by building, observing, or studying something.
- Key Findings (2–3 sentences). Provide the evidence and specific outcomes. This is usually the meat of your abstract (unless you’re writing a method paper). Quantify where possible.
- Contribution/Impact (1 sentence). The “So what?” Tie your findings to the broader HCI community.
Don’t reinvent the wheel. Just fill the slots. The abstract writes itself.
Example (the meat in this one is the solution/method):
(Context) Biofeedback provides a unique opportunity to intensify tabletop gameplay. It permits new play styles through digital integration while keeping the tactile appeal of physical components. (Problem) However, integrating biofeedback systems, like heart rate (HR), into game design needs to be better understood in the literature and still needs to be explored in practice. (Solution) To bridge this gap, we employed a Research through Design (RtD) approach. This included (1) gathering insights from enthusiast board game designers (n = 10), (2) conducting two participatory design workshops (n = 20), (3) prototyping game mechanics with experts (n = 5), and (4) developing the game prototype artifact One Pulse: Treasure Hunter’s. (Key Findings) We identify practical design implementation for incorporating biofeedback, particularly related to heart rate, into tabletop games. (Contribution/Impact) Thus, we contribute to the field by presenting design trade-offs for incorporating HR into board games, offering valuable insights for HCI researchers and game designers.
Source: Tu, J., Kukshinov, E., Hadi Mogavi, R., Wang, D. M., & Nacke, L. E. (2025). Designing biofeedback board games: The impact of heart rate on player experience. In Proceedings of the 2025 CHI Conference on Human Factors in Computing Systems (Article 466). ACM. https://doi.org/10.1145/3706598.3713543
3.2 The CARS introduction formula (Territory → Problem → Contribution)
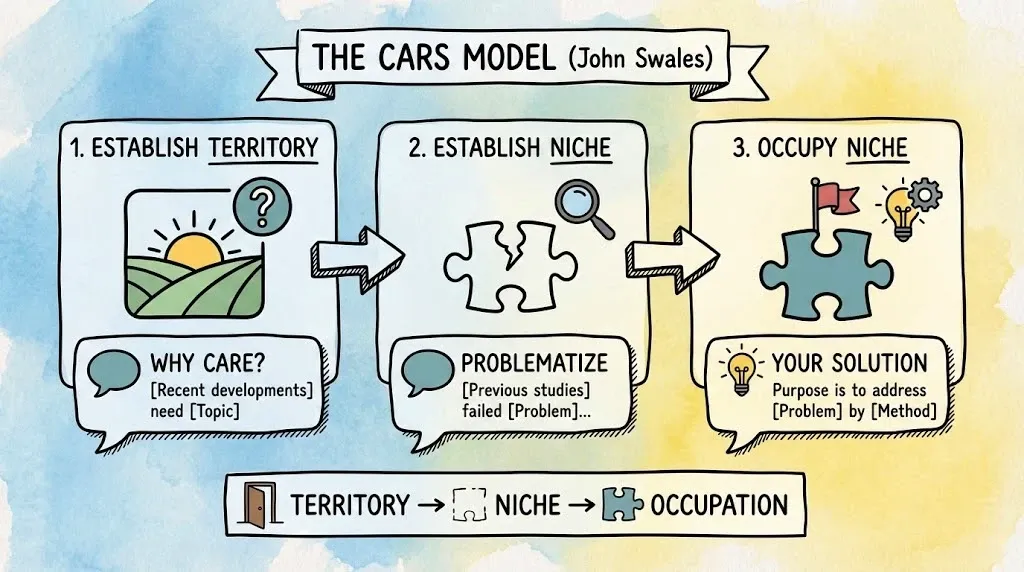
CARS stands for “Creating a Research Space.” John Swales developed it through genre analysis of research article introductions across disciplines. He studied what successful papers actually do, then named the pattern so writers could see it and reuse it. The core insight is descriptive. He found out how published introductions already work.
The model frames an introduction as three rhetorical moves that funnel from broad context to your specific niche.
CARS gives you a checklist that forces logic: Importance, gap to problem, your response. That structure makes it easier for reviewers to see your contribution fast, because they can locate the problem and the payoff without hunting. It stops vague introductions that summarize a topic without earning the reader’s attention first.
Move 1 (Establish Territory).
Ask: Why should anyone care?
- Template: “Recent developments in [Field] have heightened the need for [Topic].”
Move 2 (Establish Niche).
Problematize the current state.
- Template: “Previous studies have failed to address [Problem]…” or “Little is known about [Variable]…”
Move 3 (Occupy Niche).
State your specific solution.
- Template: “The purpose of this study is to address this problem by [Method/Action].”
Territory → Niche → Occupation. That’s the algorithm. Don’t freestyle your introduction like you’re in a jazz ensemble.
Use these three moves to organize what goes in each paragraph. Draft one or two sentences per move first, then expand with evidence and citations where they strengthen the niche claim. If your niche feels weak (“no one has studied X”), tighten the scope first. By that I mean narrow the population, method, setting, measure, or time window until the problem becomes specific and defensible.
Example (from Tu et al., 2025):
(Move 1 — Territory) Board games have begun incorporating digital elements, often called “hybrid digital games,” combining non-digital and digital components to introduce new game experiences. These hybrid board games often use companion applications on tablets or phones to manage tasks like storytelling, automated actions, or progress tracking [53]. Alternatively, so-called affective games use players’ physiological signals, or biofeedback, to directly influence the experience [75]. […] Digitally incorporated biofeedback, such as heart rate (HR), has been studied in Human-Computer Interaction as a tool to understand and improve the player experience in games [23, 45, 67, 126].
(Move 2 — Niche) However, the integration of HR into board games, particularly in multiplayer contexts, remains largely unexplored. While HR mechanics have been studied in digital single-player settings, there is a striking lack of established methods or frameworks for embedding biometric data into analog multiplayer experiences. From a design perspective, this challenge encompasses not only the task of “getting the design right” but “making the right design” [18]. […]
(Move 3 — Occupy) To understand HR integration in board games, we employ a Research through Design process [133] because it allows for iterative user testing, the creation of tangible prototypes, and the generation of reusable design assets […] We implemented three key research phases: (1) gather preliminary insights from enthusiast board game designers, (2) participatory design workshops, and (3) prototyping game mechanics with board game experts using a game prototype artifact called One Pulse: Treasure Hunter’s. […]
AI Research Stack premium members get a printable one-page CARS template this week that walks you through all three moves with fill-in-the-blank prompts. It’s the reference sheet I keep next to my keyboard when drafting introductions.
3.2.1 Alternative problem-first introduction structure
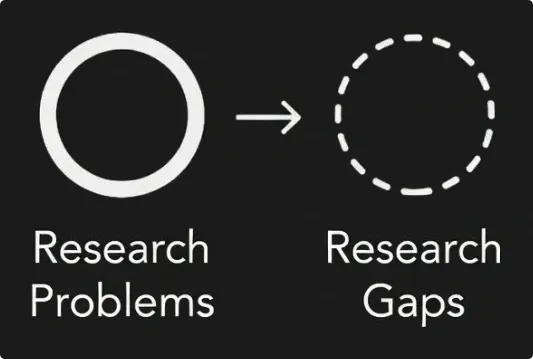
CARS works. But some papers need a different rhythm. They need to extend the idea behind CARS. Here’s an alternative that builds on CARS, but works especially well when your research problem is urgent or your field context is unfamiliar to readers. Remember that a research problem is not the same as a research gap.
- A research problem answers the “So What?” question. It’s a real-world pain, a condition that causes instability, cost, or harm. If you don’t solve this, people get sick or stay sick. Systems break. Money gets lost. Real problems transcend academic papers. They exist in the world, whether or not anyone writes about them.
- A research gap is different. It’s a void in the literature that blocks us from solving the problem right now. You find gaps in papers, usually buried in limitations or future research sections. Researchers write them down. Gaps are concrete and easier to access than the larger problem they relate to.
Thus, here’s where most people go wrong. They read the literature, summarize what’s been studied, list what hasn’t been studied, and call that a research gap. That’s not a research problem. You are merely listing unstudied variables. Nobody cares about unstudied variables unless you connect them to a real pain.
The connection between problem and gap is where you excel as a researcher.
In practice, you often work backwards. You find the gap first (because gaps are easier to spot in papers), then you work toward the problem it connects to. You ask: “Why does this gap matter? What real-world pain does it leave unsolved?”
In the paper, you present it the other way around. You start with the problem (the pain out there), then you show the gap (why this problem remains unsolved), then you present your solution (the bridge). This is the problem-first structure.
Each part does rhetorical work:
- The problem makes them care.
- The gap proves you’re the expert who has read the literature.
- The solution shows you can actually fix this.
Step 1: Start with the topic or problem. Lead with the issue itself. No throat-clearing about the field. Drop the reader directly into what’s broken, missing, or unresolved.
Step 2: Argue for the importance of the field. Now zoom out. Why does this domain matter? What’s at stake if we don’t solve this problem? This earns the reader’s attention before you ask them to follow your research journey.
Step 3: State your research questions, purpose, or hypothesis. Be explicit. “This study investigates whether…” or “We hypothesize that…” or “The objectives of this research are to…” Readers need a clear destination.
Step 4: Summarize the research gap. Connect the gap directly to the problem you opened with. The gap justifies the research. If readers don’t see why existing work fails to solve the problem, they won’t see why your study matters.
Step 5: Intersperse relevant background. Weave in social, political, historical, or scientific context that situates your work. This contextual grounding prepares readers for the deeper literature dive that follows.
This structure works well when your audience needs persuading before they’ll invest in your literature review. CARS often implicitly assumes readers already care about the territory. The problem-first structure makes them care by leading with the stakes.
3.2.2 Theoretical framework and literature review
Once your introduction lands, you have two paths: (1) Present a theoretical framework, or (2) move directly into a literature review. Sometimes you do both and combine these sections.
Theoretical framework (optional section or subsection):
A theoretical framework section does three things in sequence:
- Discuss theories relevant to your article. Survey the theoretical landscape. What lenses could someone use to understand this phenomenon?
- Introduce the specific theories you used. Narrow from survey to selection. Why these theories and not others?
- Articulate your theoretical contributions. What does your study add to or challenge about these theories?
This section can stand alone or fold into your introduction. Use it when your contribution is partly theoretical, when your method depends on a theoretical lens (like grounded theory or phenomenology), or when your audience might not share your theoretical assumptions.
Literature Review/Related Work (often a separate section):
The introduction motivates. The literature review situates. Different jobs, which is why I like to write them as different sections (which works in my field, human-computer interaction, but in fields like psychology, this is often not done this way).
A literature review provides an overview of the research areas that contribute knowledge to your study. Structure it to cover:
- Historical and contextual analysis. How did this research area develop? What were the turning points?
- Key concepts and definitions. What terms do readers need to understand your study? Define them here, not buried in your methods.
- Critical debates and frictions. Where do researchers disagree? These frictions often point to the gaps your study addresses.
- Comparison of key studies. Don’t just list papers. Compare them. What did Study A find that Study B contradicted? What methods did each use? Systematic comparison shows you’ve done the work.
- Gaps in existing research. Make the literature gaps explicit. “No study has examined X in the context of Y.” “Existing work assumes Z, but this assumption has not been tested.”
- How your study addresses these gaps. End the literature review by circling back to your contribution. The reader should finish this section understanding exactly how your research fits into, and advances, the existing conversation.
Only then do you move to methods. At this point, readers understand what you did (introduction), why it matters theoretically (framework), and how it relates to everything else (literature review). Now they’re ready to learn how you did it.
3.3 Why listing what you did isn’t enough
A methods section that can’t be attacked isn’t doing its job. A bare list of methods is like telling someone you ‘made dinner’ without mentioning you microwaved a Hot Pocket. Technically true. Yummy to some. Completely useless to your wife, who likes salads.
“We recruited 30 participants. We used a Likert scale. We ran a t-test.” That’s a list. And lists fail the most basic test of scientific writing: Could a skeptical reader disprove your claim?
This is Karl Popper’s falsifiability criterion at work. In The Logic of Scientific Discovery, Popper argued that science progresses by proposing claims that could be proven wrong, then subjecting them to rigorous tests. A claim you can’t test isn’t science. Your methods section exists to show readers exactly how they could replicate your study and (if your findings are wrong) debunk your point.
A bare list fails this test because it hides the reasoning. Why that sample size? Why that measure? Why that analysis? Without answers, a skeptical reader (most often that’s Reviewer 2) can’t evaluate whether your choices were defensible. The list looks like science but doesn’t function like science.
3.3.1 What a methods section actually covers
Before we get to structure, let’s be clear about content. A complete methods section addresses four areas:
- Materials. Equipment, participants, samples, stimuli, software, apparatus. Everything you used. Readers need to know what they would need to replicate your study.
- Procedures. Study preparation, protocols, data collection. This is the recipe: what you did, in what order, under what conditions. If you ran interviews, how long were they? If you used surveys, when and how did participants complete them? If you observed behaviour, what was the setting? Mixed methods studies describe each approach.
- Analysis. Statistical tests (for quantitative work) or analytical frameworks (for qualitative work). Which tests did you run and why? Which coding approach did you use? Thematic analysis, grounded theory, content analysis? Name the approach and justify the choice.
- Methodological issues. Problems encountered during execution. Equipment failures, participant attrition, unexpected confounds, deviations from protocol. Don’t bury these. Acknowledging issues builds credibility. Hiding them invites rejection.
Each of these four areas needs the same rhetorical treatment. You don’t just list what you did. You explain why you did it that way. And the way you explain it is identical across all four areas.
3.3.2 The three-move loop for each methodological choice
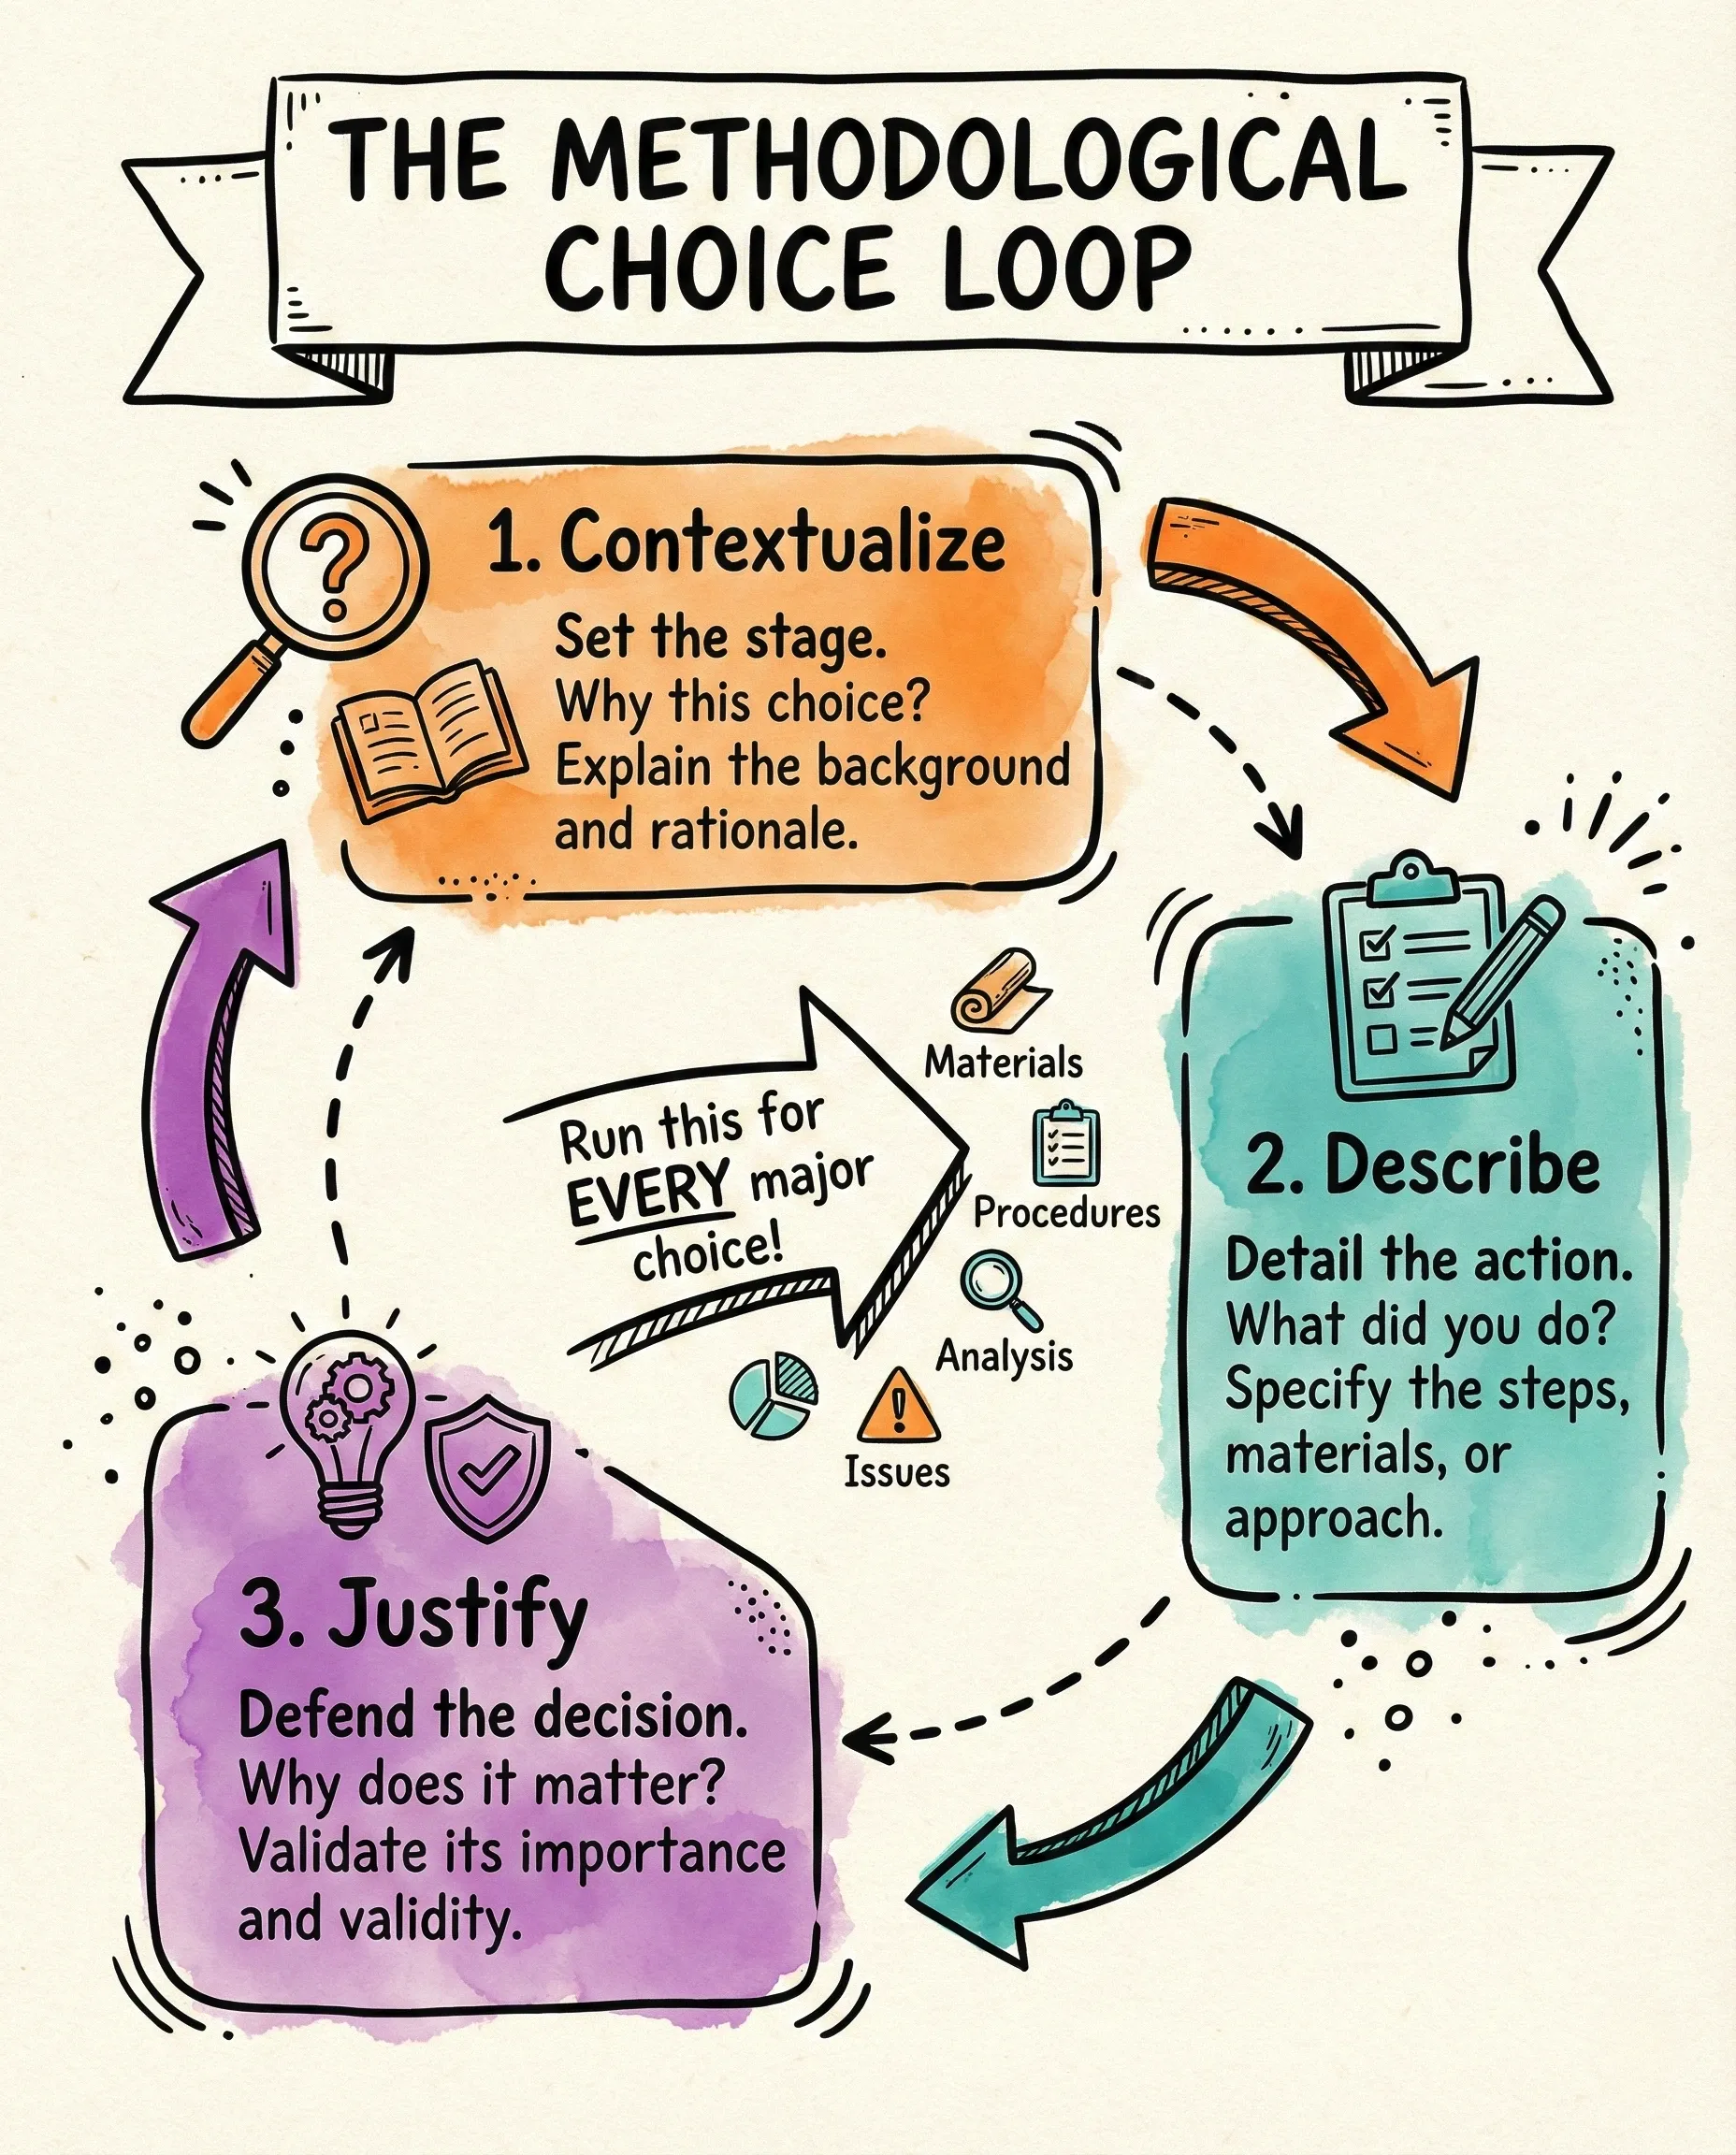
The fix is a three-move loop: Contextualize → Describe → Justify.
Run this loop for every major choice in your methods section. That means you execute the loop when you describe your materials (why these participants? why this equipment?). You execute it again for your procedures (why this protocol? why this order?). You execute it again for your analysis (why this statistical test? why this coding framework?). And you execute it again for any methodological issues (why did you deviate from the original plan? why does that deviation not invalidate the results?).
Four areas. One loop per area. Here’s what the loop looks like:
Example (from Tu et al., 2025, who described this out of sequence):
(Contextualize) The first phase of this study (RP1) focuses on gathering initial data on attitudes towards digital integration from board game designers (n = 10). These participants are primarily analog board game designers, known for their frequent enjoyment of traditional, non-digital board games. […]
(Describe) We conducted interviews both offline and online to accommodate remote participants. Interview questions explored how integrating physiological indicators, interactive displays, and accurate measurement technologies can enhance immersion, social interaction, and strategic complexity in social deception board games. The focus of the interviews was on attitudes toward designing mechanics that use HR data, shared or individual displays, and spatial dynamics to heighten tension, deception, and player engagement. A semi-structured interview (average 28:54 minutes) allowed us to collect new exploratory data relevant to our design philosophy.
(Justify) We deliberately chose this demographic for the first phase to gain insights into the perception of digital integration from the perspective of players who primarily engage with non-digital games. […]
AI Research Stack premium members get the Contextualize → Describe → Justify cheat sheet as a printable PDF. One page. Four methods areas. The loop printed clearly so you can run it without hunting through this article.
3.4 Walk readers through your data one finding at a time
Results sections fail when they become data dumps. (Sorry for any hardcore psychologist in the room, I know some of you are still purists.) Table after table, statistic after statistic, with no orienting thread. Readers lose track of which hypothesis each analysis addresses. Reviewers skim, miss the connection between your numbers and your claims, and remain unclear how this supports the argument.
The problem is cognitive. By the time readers reach your results, they’ve processed your introduction, literature review, and methods. Working memory is nearly full. Now you’re asking them to absorb dense statistical output and remember which research question each test addresses and translate numbers into meaning. That’s too many demands at once. Make it easy for them instead.
3.4.1 What a results section actually covers
Before we get to structure, let’s be clear about content. A results section is pure description. You report what you found. No interpretation yet. That comes in the discussion. Within that constraint, results sections typically cover four content areas:
- Significant findings in plain words. Open with the headline. State your main results in accessible language before diving into statistics. Readers need orientation before detail.
- Adjustments and exclusions. Data rarely arrives clean. Report any exclusions (outliers removed, participants dropped, missing data handled) and adjustments (transformations, recoding, combining variables). This belongs early because it affects how readers interpret everything that follows.
- Qualitative results (if applicable). Participant observations, interview excerpts, thematic patterns. These provide texture and evidence for your interpretive claims. Select only the participant quotes that do rhetorical work.
- Quantitative results with tables and figures. Descriptive statistics (means, standard deviations, frequencies) and inferential statistics (tests, effect sizes, confidence intervals). Tables and figures carry the heavy lifting here.
One critical rule: Never duplicate information across tables and figures. A table shows exact numbers. A figure shows patterns, trends, or relationships. If you have both, they should complement each other. A bar chart that simply visualizes the same numbers already in a table wastes space and insults the reviewers (also can get you desk-rejected).
Results sections are figure-heavy by design. Your figures and tables are the evidence. The prose narrates them, points to what matters, and connects them to your research questions. Think of the prose as a tour guide walking readers through an exhibit of figures.
3.4.2 The Remind → Describe → Explain loop for each finding
Now that you know what goes in a results section, here’s how to structure each finding so readers can follow without getting lost.
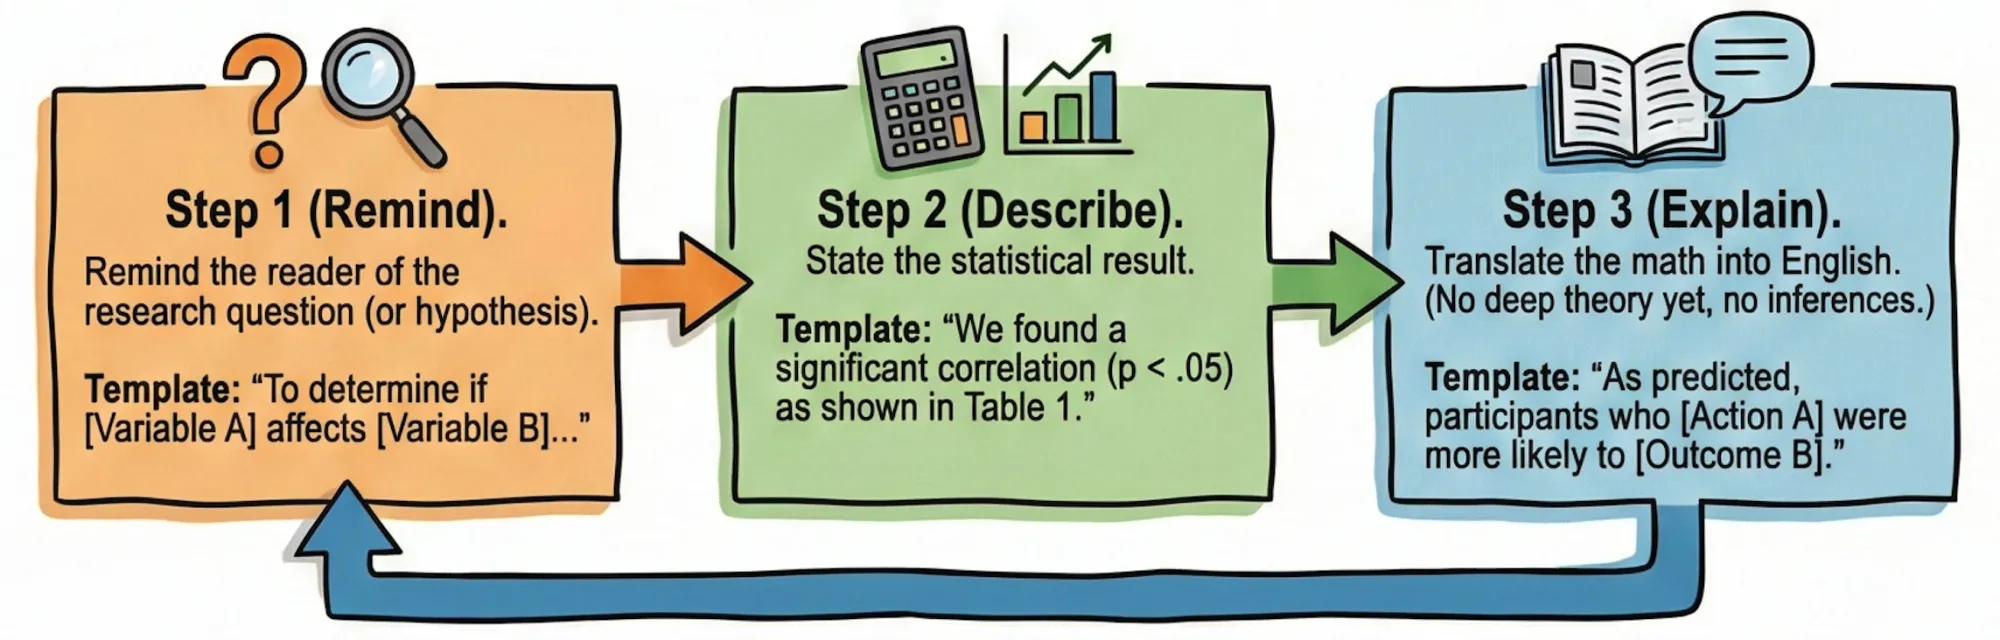
The Remind → Describe → Explain pattern does the cognitive work for the reader. You reactivate the relevant hypothesis before presenting data. You report the statistics cleanly. Then you translate the numbers into plain English (without interpretation mind you) before moving on. Each finding becomes a self-contained unit that readers can follow without flipping back to your research questions.
This structure also protects you during review. When Reviewer 2 asks “How does this analysis address RQ3?”, the answer is already in the text, because you explicitly linked the result to the question before presenting it. (Now, mind you, Reviewer 2 has opinions. Strong ones. They will find your Results section at 1 AM on a Sunday and write 1,200 angry words about your sample size. Be ready.)
Step 1 (Remind). Remind the reader of the research question (or hypothesis).
- Template: “To determine if [Variable A] affects [Variable B]…”
Step 2 (Describe). State the statistical result.
- Template: “We found a significant correlation (p < .05) as shown in Table 1.”
Step 3 (Explain). Translate the math into English. (No deep theory yet, no inferences.)
- Template: “As predicted, participants who [Action A] were more likely to [Outcome B].”
Remind → Describe → Explain. Each finding gets this treatment. The reader never gets lost. Think of it like giving directions. First, remind the reader where they’re going (“We’re testing if X affects Y”). Then, show them the numbers (“We found this result”). Finally, explain what those numbers mean in plain language (“This means people who did A were more likely to do B”). When you follow this pattern for every result, your reader can easily follow along without getting confused or having to flip back to earlier pages.
Example (from Tondello et al., 2016):
(Remind) Our analysis included the following measures, as reported in the Methodology section: scale reliability, distribution of the user types scores, scale correlation with personality traits, and scale correlation with game design elements.
(Describe) “Table 6 presents the bivariate correlations coefficients and significance levels between each Hexad user type and each of the Big Five model personality traits, measured by Kendall’s τ. […] The Free Spirit type is positively correlated with openness, supporting hypothesis H2, and also positively correlated with extraversion and negatively with neuroticism.”
(Explain) “H2: supported. The Free Spirit user type was positively correlated with openness to experience.”
Source: Tondello, G. F., Wehbe, R. R., Diamond, L., Busch, M., Marczewski, A., & Nacke, L. E. (2016). The Gamification User Types Hexad Scale. In Proceedings of the 2016 Annual Symposium on Computer-Human Interaction in Play (pp. 229–243). ACM. https://doi.org/10.1145/2967934.2968082
AI Research Stack premium members get all three structural templates this week: CARS for introductions, the methods loop, and this Remind → Describe → Explain pattern for results. Each one is a single-page PDF reference sheet you can print and keep at your desk.
3.5 How to widen from findings to field-level impact
This is where most writers struggle. The introduction funnels from broad to narrow. The discussion does the reverse: Open narrow (your findings) and widen out to the broad field.
Your results don’t mean anything in isolation. A statistically significant effect size tells readers what happened but not why it matters. The discussion is where you answer the “So What?” question by connecting your specific findings to the broader conversation in your field. Without this connection, reviewers see a technically competent study that doesn’t advance knowledge. They’ll see a limited contribution and reject your paper.
Most graduate training emphasizes doing research (that’s why you know how to collect the data). The interpretive move, asking “what does this mean for the field?”, requires a different skill set (that most professors just don’t teach you). You need to hold your findings in one hand and the entire literature in the other, then explain where the two connect. Bazinga. That demands deep familiarity with your field’s open questions, not just the papers you cited in your lit review. Many grad students haven’t read widely enough to see those connections yet. They know their study. They don’t yet know the field. That’s why you should run reading circles or give grad students reading assignments. AI summaries don’t cut it for this knowledge.
Here’s an easy way to unstick yourself. Imagine your related work authors are guests at a dinner party, and your study just arrived. What would they say to each other?
Nacke (2019) is holding a wine glass while he is nibbling on some fancy cheese, nodding vigorously with his mouth full (that old slob). Hamari (2019, 2020, 2021) is having a whiskey about it. Tu (2025) is shaking their head. Mogavi (2021) is chill and trying to get everyone to calm down and see the nuance. Your results just walked into this conversation looking like Vanilla Ice, the rapper not the ice cream flavour.
Write that fun conversation. Each exchange becomes a paragraph in your discussion. This way of thinking reimagines your study as part of a bigger conversation with other researchers. The dinner party metaphor make you think of earlier research papers as people you’re talking to, who have their own ideas.
3.5.1 What a discussion section actually covers
Before we get to structure, let’s be clear about content. A discussion section does the interpretive work that your results section deliberately avoided. Results describe what you found. Discussion explains what it means. Within that frame, discussion sections cover five content areas in sequence:
- Summary of key points. This is a cognitive reset. By the time readers reach your discussion, they’ve processed your entire paper. Working memory is strained. You open by briefly restating your main findings, not to rehash statistics, but to get everyone back on the same page. Think of it as saying: “Here’s what we found. Now let’s talk about what it means.”
- Interpretation of results. This is the heavy lifting you couldn’t do in the results section. What do your findings actually mean? Why did participants behave the way they did? What mechanisms explain the patterns you observed? This is where you move from description to explanation. Don’t rush it. This is the meaty, juicy core of your discussion.
- Comparison with existing literature. Now you situate your findings in the field. How do your results relate to what others have found? Do they support, contradict, or extend prior work? This is where the dinner party metaphor comes alive. Each comparison is a conversational exchange between your study and someone else’s.
- Contribution to the research question. This is your exclamation mark. After interpreting and comparing, you state clearly what your study contributes. You can foreshadow this at the beginning of the discussion, but you place the full statement here, at the end of the interpretive work, so it lands with impact. This is the “so what” that ties everything together.
- Limitations (and successes). What went right and what went wrong? Be your own red team. Acknowledge the boundaries of your claims. This honest accounting builds credibility and helps readers calibrate how much weight to give your findings.
These five areas form the interpretive core of your discussion. What comes next, the conclusion, may be a separate section or a final subsection within the discussion. That varies by field and venue.
3.5.1 Conclusion: separate section or final subsection
The conclusion serves a different function than the discussion. Discussion interprets. Conclusion synthesizes impact. Some readers scan the conclusion first, looking for the bottom line. Your conclusion must deliver that bottom line clearly.
A complete conclusion covers four elements:
- Main contributions to the field. Remind the reader what this research adds to the broader conversation. This echoes the contribution statement from your discussion, but frames it for someone who might be reading the conclusion in isolation.
- Significance of achievements. Don’t just state what you contributed. Explain why it matters. What changes because this research exists? What can people do now that they couldn’t do before?
- Recommendations. Lean out of the window a little. What should practitioners, designers, policymakers, or other researchers do with this knowledge? Don’t just deposit findings. Tell readers what to do with them. Keep recommendations grounded and actionable.
- Future areas for investigation. What questions remain? What should the next study examine?
A note on field variation: In HCI and many SIGCHI venues, future work typically appears before the conclusion, often as its own subsection (e.g., “Limitations and Future Work”). The conclusion then wraps up with contributions, significance, and a final recommendation. In other fields, future work folds into the conclusion itself. Know your venue’s conventions.
Ending options: A strong conclusion can end two ways. It can close with a grounded recommendation (“Designers should prioritize X over Y”). Or it can close with a forward-looking statement about what future research must address (“Understanding mechanism Z remains the critical next step”). Either works. Choose based on what your study best supports.
3.5.2 The structural template for discussion sections
This template maps directly onto the five content areas above. Use it as a checklist.
Part 1: Summary and Positioning (1–2 paragraphs)
Open with a brief summary of your key findings (cognitive reset), then immediately position your work against prior literature. This part does three jobs at once: it reminds readers what you found, shows how your findings relate to existing work, and previews your contribution.
- Template: “We set out to [Goal]. Our findings indicate [Main Finding]. This [extends/supports/contradicts] prior work on [Framework/Taxonomy], which [What Prior Work Did].”
- Do not rehash statistics. Summarize meaning. The summary is implicit in shorter papers but should be explicit in longer ones where readers may have lost the thread.
Part 2: Interpretation and Implications (the core)
This is where the heavy lifting happens. You interpret your findings, compare them to existing literature, and explain what they mean for specific audiences.
- In shorter papers (late-breaking work, short papers): 2–4 paragraphs doing interpretation + comparison + contribution. No subsections needed.
- In longer papers (full papers, journal articles, taxonomy papers): this part fans out into thematic subsections. Each subsection is labelled “Implications for [Audience/Domain]” and walks through what your results mean for that stakeholder group.
- Structure per subsection: Interpret the finding → Compare with prior literature (support or contradict) → Explain what this means for that audience.
Part 3: Contribution (1 paragraph, or woven into Part 2)
After the interpretive work, state your contribution explicitly. This is your exclamation mark. You can foreshadow it in Part 1, but the full statement lands here, at the end of interpretation, so it carries weight.
- Template: “Taken together, these findings contribute [Specific Contribution] to the field of [Domain].”
- In some papers, the contribution is woven into the final implications subsection rather than stated separately. Either works.
Part 4: Limitations (1 subsection)
Be your own red team. Acknowledge what went right and what went wrong.
- Template: “These findings should be interpreted with caution due to [Limitation]. This was mitigated by [Defence], but future work should [Address].”
Part 5: Conclusion (separate section or final paragraphs)
Synthesize impact for readers who may scan here first. Cover contributions, significance, recommendations, and (in some fields) future work.
- Template: “This research contributes [What] to [Field]. These findings suggest that [Broad Implication]. [Practitioners/Designers/Researchers] should [Recommendation].”
The underlying logic: Summary → Interpretation → Comparison → Contribution → Limitations → Conclusion. That’s the reverse hourglass. You open narrow (your findings), widen through interpretation and comparison, land the contribution, acknowledge boundaries, and close with impact.
Example (from Hadan et al., 2025):
(Part 1 — Summary and Positioning: Comparison + Contribution Preview)
“Our research extends prior literature by categorizing AI incidents across the four stages of the AI lifecycle (Ng et al., 2022), which offers a more detailed and actionable perspective on their occurrence. We also empirically synthesized the relationships between incident types, contextual factors, and their occurrence frequency in real-world contexts. This approach supports more targeted prevention strategies compared to studies that either did not address AI incidents within the lifecycle (e.g., Zeng et al., 2024), only distinguished pre- and post-deployment incidents (e.g., Slattery et al., 2024; Yampolskiy, 2016), or ignored the contextual factors (e.g., Shelby et al., 2023; Zeng et al., 2024).”
Notice: The summary of findings is implicit (“categorizing AI incidents,” “empirically synthesized relationships”). The bulk of this paragraph does comparison and contribution positioning. This is typical of taxonomy papers where the contribution is the classification.
(Part 2 — Interpretation and Implications: Four Thematic Subsections) The paper fans out into four “Implications for…” subsections. Each interprets findings, compares to prior work, and explains what it means for a specific audience:
5.3 Implications for raising public awareness: “Prior studies have emphasized the importance of educating users about manipulative tactics (Hadan et al., 2024)… Our findings indicate that AI can be used to exacerbate the creation of hyperpersonalization and emotional manipulation… Thus, improving people’s AI literacy for them to effectively recognize and resist the AI-driven manipulation and harmful outcomes become essential.”
(Interpretation: AI exacerbates manipulation. Comparison: Prior work on user education. Audience takeaway: AI literacy is essential.)
5.4 Implications for future AI incident reporting: “Our findings emphasize the critical need for standardized, comprehensive AI incident reporting frameworks to ensure more consistent and transparent documentation of AI incidents and contextual factors that contributed to the incidents.”
(Interpretation: Current reporting is inconsistent. Audience takeaway: Standardized frameworks needed.)
5.5 Implications for future AI incident detection and prevention: “Our analysis revealed that AI developers and adopting organizations and government entities were identified as the primary responsible entities in more than half of incidents we analyzed… These incidents highlight the need for improved methods to detect and prevent AI incidents and for establishing baseline standards for AI development and deployment.”
(Interpretation: Developers and organizations are primary responsible entities. Audience takeaway: Better detection methods and baseline standards.)
5.6 Implications for future AI incident governance and regulation: “Our findings suggest the insufficiency of existing organizational and governmental AI governance systems, as over half of the incidents (n = 117, 58%) we analyzed were due to organizational issues among AI developers and adopting organizations and government entities…”
(Interpretation: Current governance is insufficient. Audience takeaway: Proactive governance measures needed.)
(Part 3 — Contribution)
In this paper, the contribution is woven into the implications subsections and restated in the conclusion rather than appearing as a standalone paragraph.
(Part 4 — Limitations)
“While our research offers valuable insights into AI privacy and ethical incidents, we acknowledge several limitations that may guide future work. First, our analysis focuses exclusively on incidents reported on the AIAAIC repository from 2023 and 2024. As AI technologies evolve, the incidents and the associated contextual factors may change.”
(Part 5 — Conclusion)
“Our research builds on and extends existing work by offering a more comprehensive and detailed AI incident taxonomy. This taxonomy captures cases previously hypothesized in the literature and novel incident types and contributing factors that existing frameworks fail to address… As AI continues to shape global policies, economies, and societal norms, the urgency to establish proactive, enforceable governance measures cannot be overstated.”
(Section 3 — Limitations)
“While our research offers valuable insights into AI privacy and ethical incidents, we acknowledge several limitations that may guide future work. First, our analysis focuses exclusively on incidents reported on the AIAAIC repository from 2023 and 2024. As AI technologies evolve, the incidents and the associated contextual factors may change. […]”
(Contribution restated. Significance explained. Ends with a recommendation framed as urgency.)
Source: Hadan, H., Hadi Mogavi, R., Zhang-Kennedy, L., & Nacke, L. E. (2025). Who is responsible when AI fails? Mapping causes, entities, and consequences of AI privacy and ethical incidents. International Journal of Human–Computer Interaction. https://doi.org/10.1080/10447318.2025.2549073
Premium AI Research Stack members get these five templates pre-built in a Notion workspace. One click to duplicate.
4. Use AI to critique your writing, not to write for you
When ChatGPT came out, I initially resisted it as a tool for academic work, but I quickly changed my mind as more LLMs and AI tools came out and I saw them make huge improvements in extremely short periods of time. As I understood prompt engineering better, I was hooked. I got a feel for what it hallucinates and learned how to operate it better by providing proper context. That’s when I really got a hang of how the right prompting structures influence the LLM output that I get.
Let me be clear here. We do not use AI to write our papers start to finish. It hallucinates citations (outside of NotebookLM or more recently OpenScholar, try out the demo), often produces generic prose, and still lacks your intellectual fingerprint. But we include it in every writing process and we always refine our prompts and workflows (or create new skills in Claude Code/Co-Work). AI is extremely useful for offloading specific cognitive tasks that drain you. Frame it this way: AI is your intellectual sparring partner, but it’s not your ghostwriter. Muhammad Ali had a sparring partner. He still threw the punches in the ring.
One of my favourite prompts assigns the AI a persona of a senior academic editor and runs it through three phases on your pasted draft. First, it summarizes your paper’s core argument in three sentences (claim, evidence, contribution) so you can confirm the AI actually understood what you wrote. Second, it identifies up to five structural problems, ranked by severity, with each one named, located by section and paragraph, explained in terms of how it breaks the argument, and paired with a one-sentence fix. Third, it recommends any section-level restructuring (moves, merges, or cuts). The constraints keep the AI locked on architecture only: no grammar, no word choice, no rewrites. The output format is standardized so you get a scannable diagnostic report, not a wall of prose. The whole design forces the AI to work like a structural X-ray of your paper, catching misaligned research questions, missing logical steps, redundant sections, and scope drift before you waste hours polishing sentences that might get cut anyway.
Here is the full prompt (AI Research Stack Members can also download the full skill file at the very bottom of this article and get installation instructions in Notion):
Three examples of how I have used AI in the past:
- Reverse Outlining. Paste your draft and ask: “Extract the logical outline of this argument. Where is the reasoning weak?” This offloads the zooming out cognition work that’s hard to do when you’re deep in the text. (AI Research Stack Members get the full prompt below.)
- Red Team Review. Paste your methods section and ask: “Act as a skeptical Reviewer 2. Identify three methodological concerns.” Better to find holes now than in your rejection letter. (AI Research Stack Members get the full prompt below.)
- Clarity Editing. For clunky paragraphs: “Act as an academic editor. Improve clarity, coherence, and conciseness without changing meaning. Let every word earn its place.” This is polishing. You’re offloading the micro-level optimization. (AI Research Stack Members get the full prompt below.)
Of course, there are a whole bunch more approaches like my personalization prompts that get rid of many AI writing quirks that current models have. I’ll share some for premium subscribers of my newsletter this week.
Frame it this way. AI is always your intellectual sparring partner It evaluates your thinking under stress so your working memory doesn’t have to hold everything at once.
5. Fix the big problems before you polish the small ones
When you revise, you face a decision at every sentence: what should I fix? Most people fix whatever catches their eye. A typo here, a weak word there.
This is inefficient. You might polish a paragraph that gets cut when you realize the section doesn’t work. Fixing typos before fixing structure is like polishing the silverware while your house is on fire. Admirable attention to detail, Sheldon. Completely wrong priority.
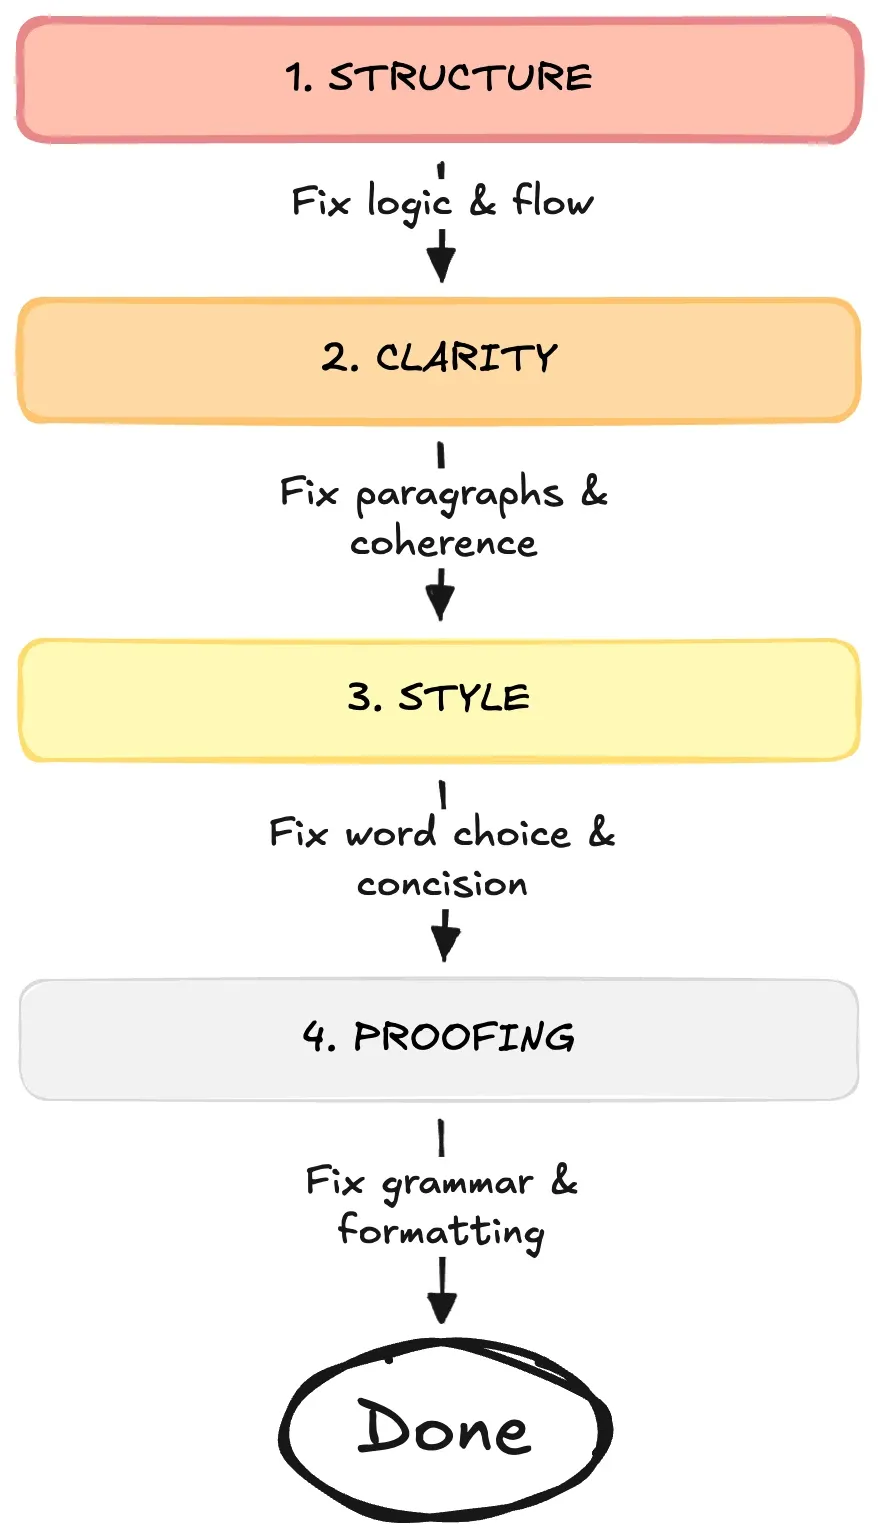
Always revise in this order:
- Structure. Is the argument logical? Does the paper flow broad → narrow → broad? If structure is broken, sentence-level fixes are wasted work.
- Clarity. Does each paragraph have one job? Do topic sentences actually summarize? Is there fat to cut?
- Style. Kill weasel words (seems, perhaps, might). Kill zombie nouns (conduct an analysis → analyze). Tighten prose.
- Proofing. Grammar, spelling, formatting. Last, because everything above might change.
When you’re fixing your research paper, start with the biggest problems first and work your way down to the smallest ones. Think of it like fixing a house. If the whole building is tilted, you need to fix the foundation before you paint the walls. Structure is like the foundation of your paper because it affects every single part. If your main argument doesn’t make sense or your sections are in the wrong order, nothing else matters yet. Once the structure is solid, move on to clarity so that each paragraph is easy to understand. Then work on style, which means choosing better words and making sentences flow smoothly. Finally, fix typos and grammar mistakes at the very end. These small errors only affect one or two words, so save them for last. If you fix typos first and then realize you need to delete that whole paragraph, you’ve wasted your time. Always work from big to small, and you’ll save yourself hours of unnecessary editing.
6. The complete system
Five protocols that reduce cognitive load at every stage:
- Inverted Assembly Line: Write sections in cognitive-load order (Figures → Methods → Results → Discussion → Introduction → Abstract), not document order.
- Zero Draft: Separate generation from evaluation completely. Write fast and messy first. Edit later.
- Structural Templates: Use proven formulas for each section so you focus on content, not organization.
- Abstract: Context → Problem → Solution → Findings → Contribution
- Introduction: Territory → Niche → Occupy (CARS)
- Methods: Contextualize → Describe → Justify
- Results: Remind → Describe → Explain
- Discussion: Answer → Implications → Limitations → Conclusion
- AI Sparring: Offload critique, outlining, and clarity editing to AI. Keep the actual writing human.
- Hierarchical Revision: Fix problems in order of impact. Structure first, then clarity, then style, then proofing.
Each protocol removes a specific cognitive bottleneck. Together, they turn writing from a willpower battle into a systematic process.
Your brain is a supercomputer running sophisticated cognition. Stop asking it to juggle and start giving it sequential, well-scoped tasks.
That’s how you write better papers in less time.
The protocols above are the complete system. Premium AI Research Stack members get the Notion page that runs it, plus this week’s 7 AI prompts for every revision stage. Add to that three printable structural PDF templates (CARS Introduction, Methods Loop, Results Pattern) as cheat sheets to print out and keep at your desk.
Bonus Materials
AI Research Stack members this week also get the argument audit Claude skill (and installation instructions in Notion), the 7 AI audit and revision prompts, 5 PDF worksheets in total, and a pre-submission checklist. Join them.


