

Key points
- GRADE turns evidence evaluation into a structured, transparent system.
- 5 factors downgrade certainty: bias, inconsistency, indirectness, imprecision, publication bias.
- 3 factors upgrade certainty: large effects, dose–response, and plausible confounding.
- Four evidence levels: High, Moderate, Low, Very Low.
- Used worldwide to determine which research actually deserves trust.

Stuck staring at your methods section? This 7-day email course walks you through choosing your methodology, designing your study, and analyzing data without the academic jargon. Get a mind map that shows how everything connects. $49.99 gets you started immediately.
I remember the exact moment I realized most people (including many researchers) fundamentally misunderstand how to evaluate scientific evidence.
I was deep into reviewing yet another systematic review paper in HCI when I hit my breaking point. The authors had dutifully collected dozens of studies, categorized them neatly, and drawn sweeping conclusions about user experience interventions. But as I read through their methodology, a familiar frustration crept in. I could not see them using a systematic way to assess whether we could actually trust any of this evidence they had collected.
Sure, they’d noted which studies were experimental versus observational studies. They’d counted sample sizes and noted statistical significance. But nowhere did they grapple with the fundamental question that should drive every research synthesis: How confident should we be in these findings?
| Category | Factor | Effect on Certainty | What It Means |
|---|---|---|---|
| Down- grades | Risk of Bias | ↓ | Weak design or poor execution (e.g., no blinding, high dropout). |
| Inconsistency | ↓ | Conflicting results without clear explanation. | |
| Indirectness | ↓ | Different population, dose, or outcome than your question. | |
| Imprecision | ↓ | Small samples or wide confidence intervals. | |
| Publication Bias | ↓ | Missing or unpublished negative studies. | |
| Up- grades | Large Effect Size | ↑ | Clear, strong effect unlikely to be due to chance. |
| Dose–Response Relationship | ↑ | Larger exposure consistently yields larger effect. | |
| Plausible Confounding | ↑ | Biases would make the effect smaller, not larger. |
And I wasn’t just upset the study didn’t use the many critical appraisal tools that I talked about in last week’s newsletter (though those are sorely lacking in HCI). What I found in front of me was the complete absence of a framework to evaluate evidence certainty. A paper could cite fifty studies and still leave readers with no clear sense of whether the conclusions were rock-solid or dipped deep into Jello.
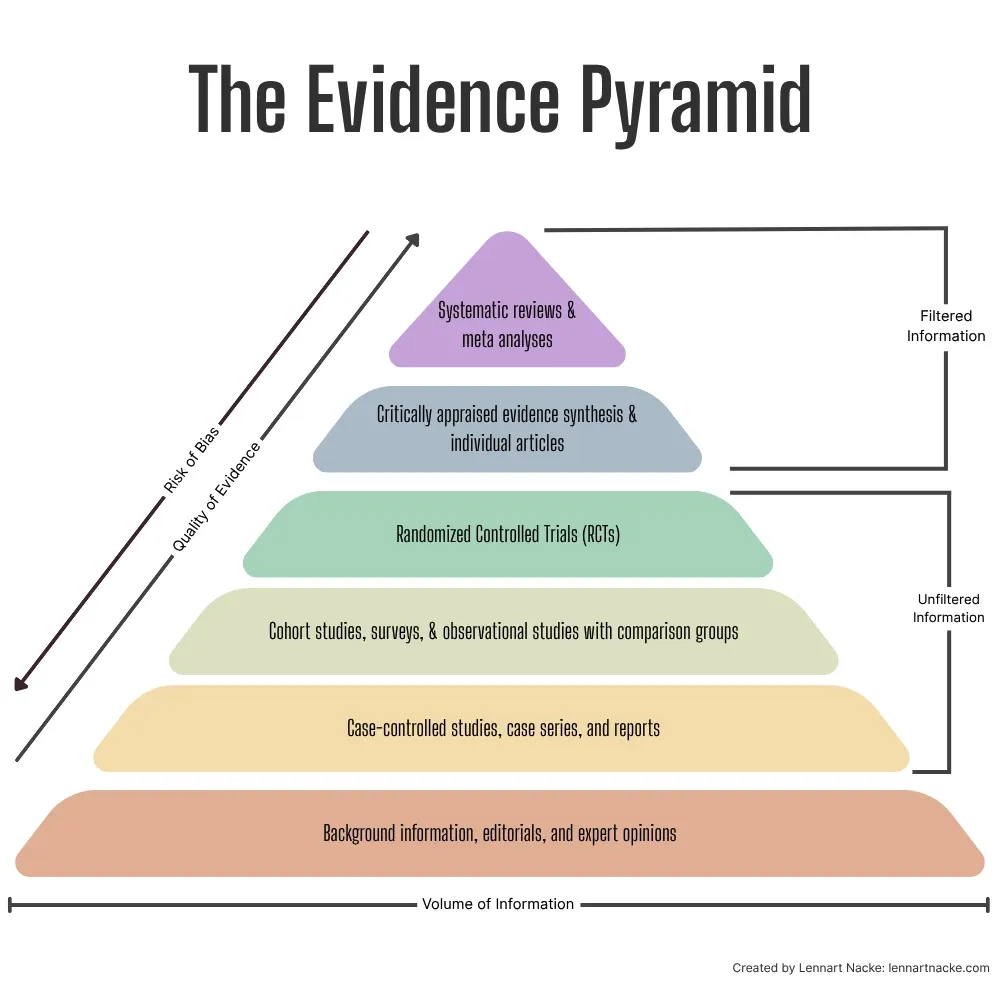
As an aside, yes, the hierarchy of evidence definitely also matters for finding quality research. Meta-analyses and systematic reviews sit at the top of this evidence pyramid, because they synthesize findings from multiple studies. Similarly, critically appraised syntheses and articles count as the top category. Below these are RCTs, which provide strong evidence through careful experimental design. Observational studies, cohort studies, regular literature reviews, and non-RCTs are in the middle of the hierarchy, while case reports, animal, and in-vitro studies occupy lower levels of the hierarchy but still contribute valuable insights in specific contexts.
Knowing how this hierarchy works lets you choose better sources for your paper. For example, if you’re researching a medical treatment’s effectiveness, a meta-analysis combining results from multiple RCTs would provide stronger evidence than a single case study. However, critical thinking is still essential when applying the hierarchy. While meta-analyses and systematic reviews generally provide the strongest evidence, you should also consider factors like study recency, relevance to your specific question, and potential biases.
Anyways, after that frustration when reviewing that paper was when I discovered the GRADE framework, a systematic approach that over 100 organizations, including the World Health Organization and Cochrane, use to cut through the noise and determine which evidence actually deserves our trust (see the GRADE framework handbook).
The problem with how we think about evidence
Most people treat evidence evaluation like the simple hierarchy pyramid that I introduced above. Systematic reviews and randomized controlled trials sit at the top levels, observational studies somewhere in the middle, and everything else falls closer to the bottom. But this oversimplified view misses a crucial point: quality varies dramatically within each category.
A poorly designed RCT with serious bias problems might actually be less reliable than a well-executed observational study with clear results. The study design is just the starting point for a good paper but not the final word.
This is where GRADE changes how we evaluate evidence. Instead of relying on crude hierarchies, it asks the right question: “After finding and appraising all the relevant studies, how confident should we be in the estimate of effect?”
The beauty of GRADE lies in its systematic approach to answering this “so what?” question. After you’ve found and appraised all the relevant studies, GRADE forces you to step back. The system produces four distinct certainty ratings: High, Moderate, Low, or Very Low. Each rating comes with a clear interpretation that removes ambiguity from evidence evaluation.
Your starting point depends entirely on study design. Evidence from randomized controlled trials begins at high certainty (e.g., these studies are designed to minimize bias and establish causal relationships). Observational studies start at low certainty because they’re more susceptible to confounding and can only establish associations, not causation.
But here’s where it gets interesting: that initial rating is just the beginning of the evaluation process. The real work happens when you apply the eight factors that can modify this starting point.
Five factors that drag your evidence certainty down the ladder
Risk of bias is the first culprit that can sink your evidence rating. If your body of evidence consists mostly of studies with serious methodological flaws (think inadequate randomization, lack of blinding, or high dropout rates) your certainty gets downgraded. Tools like RoB 2 for randomized trials and ROBINS-I for observational studies help identify these issues systematically.
Inconsistency hits when studies show wildly different results that can’t be explained. If one study shows a treatment reduces heart attacks by 50% while another shows no effect at all, and you can’t determine why, your confidence in the overall estimate should plummet accordingly.
Indirectness occurs when the evidence doesn’t directly answer your research question. Maybe the studies looked at a different population than the one you’re interested in, or they used a different intervention dose, or they measured outcomes differently. Each mismatch between your question and the available evidence chips away at certainty.
Imprecision shows up when results are statistically fragile: Small sample sizes, few events, or confidence intervals so wide you could drive a big Mack Truck through them. If the true effect could be substantially different from what the studies suggest, you can’t be confident in the estimate.
Publication bias is the sneakiest one. If there’s strong suspicion that studies with negative or unfavourable results never saw the light of day, your evidence base is skewed toward positive findings. Funnel plot analyses can help detect this problem, but it’s often difficult to quantify, so remain on alert.
Three factors that drive observational evidence ratings up
Here’s where GRADE gets really sophisticated. For observational studies that start at low certainty, certain conditions can actually upgrade the rating.
A large effect can bump up your confidence level. If observational studies consistently show a massive effect (say, a relative risk greater than 2 or less than 0.5) and there’s no plausible confounding that could explain it away, you can upgrade from low to moderate certainty. The logic here is simple: It’s harder for bias to create a large effect than a small one.
A dose-response gradient strengthens the case for causation. If higher doses or more intense exposures lead to greater effects in a predictable pattern, this biological plausibility increases confidence that you’re looking at a real causal relationship rather than just a correlation.
Plausible confounding that would reduce the observed effect is the trickiest upgrade factor. If all the confounding factors you can think of would have actually made the intervention look worse, not better, then the true effect might be even stronger than what the studies show.
The final ratings give you actionable confidence levels
After working through all the upgrading and downgrading factors, you end up with one of four certainty levels, each with clear practical meaning.
High certainty means you’re highly confident the true effect lies close to the estimate. This is your gold standard: The kind of evidence that should drive clinical guidelines and policy decisions without much hand-wringing.
Moderate certainty indicates you’re reasonably confident, but there’s a possibility the true effect could be substantially different. You might proceed with recommendations but acknowledge the uncertainty and monitor for new evidence.
Low certainty means your confidence is limited. The true effect may be substantially different from the estimate, so recommendations should be conditional and preferences should weigh heavily in decision-making.
Very low certainty is essentially a warning flag. You have only little confidence in the effect estimate, and the true effect is likely to be substantially different. Any recommendations should be tentative at best.
Why this framework changes everything
The beauty of GRADE lies in its systematic transparency. It transforms evidence evaluation from an art into a science. Instead of vague statements about study quality, you get transparent, systematic assessments that anyone can understand and replicate.
This transparency is crucial because it forces explicit consideration of all the factors that affect evidence quality. No more black-box decisions where experts mysteriously conclude that evidence is good or bad without explaining their reasoning.
For researchers, clinicians, and policymakers, GRADE provides a common language for discussing evidence quality. When someone says the evidence is moderate certainty, everyone knows exactly what that means and what factors led to that rating.
The framework also helps you identify where future research efforts should focus. If evidence is downgraded for imprecision, you need larger studies. If inconsistency is the problem, you need to figure out why studies disagree. This targeted approach makes research more efficient and impactful.
The GRADE framework gives us a common language for discussing evidence quality. When someone says the evidence has “moderate certainty,” everyone knows exactly what that means and what factors led to that rating. This helps us make better decisions with incomplete information, which is what science and life are really about.
P.S.: Curious to explore how we can tackle your research struggles together? I've got three suggestions that could be a great fit: A seven-day email course that teaches you the basics of research methods. Or the recordings of our AI research tools webinar and PhD student fast track webinar.
Learn more about GRADE
GRADE Working Group. (2004). Grading quality of evidence and strength of recommendations. BMJ, 328(7454), 1490.


